Trend weight vs scale weight: how the smoothing works

Weigh yourself two mornings in a row. Same scale, same tile, after the toilet, before your first drink. The number can still move 0.4 kg, and nothing about your fat mass changed while you slept.
The gap between the scale and what your body actually did is the whole problem, and it’s why the weight trend in Track is the number worth reading instead of this morning’s raw one. Trend weight is the same measurement, filtered.
What follows is the arithmetic: how big the noise is, how the filter works, how far behind it runs, and when to stop believing it.
What is trend weight, and how is it different from scale weight?
Scale weight is one raw reading of total mass: tissue, water, glycogen and whatever is still in your gut. Trend weight is an estimate of where that mass actually sits once the day-to-day movement has been filtered out, and an exponentially weighted moving average is one way to produce that estimate.
Put a number on the noise. A 26.1 year series of standardised daily weigh-ins, 9,521 days from one healthy man measured under controlled conditions, found the day-to-day difference in body mass had a standard deviation of 0.53%. On an 80 kg lifter, that’s about 0.4 kg of ordinary daily movement, and a 2 SD day, which turns up often enough, is 0.85 kg.
Put a number on the signal. The rate of loss that protects lean mass on a cut is 0.5 to 1% of bodyweight per week, so 0.07 to 0.14% per day. The noise is 4 to 7 times the size of the signal you’re trying to detect. One reading cannot tell you which way you’re going.
Your scale isn’t the culprit. Measurement error in that dataset was 0.1 kg, about 0.12% of body mass, roughly a quarter of the biological variation. Better hardware changes very little. The filter is what gives you the answer.
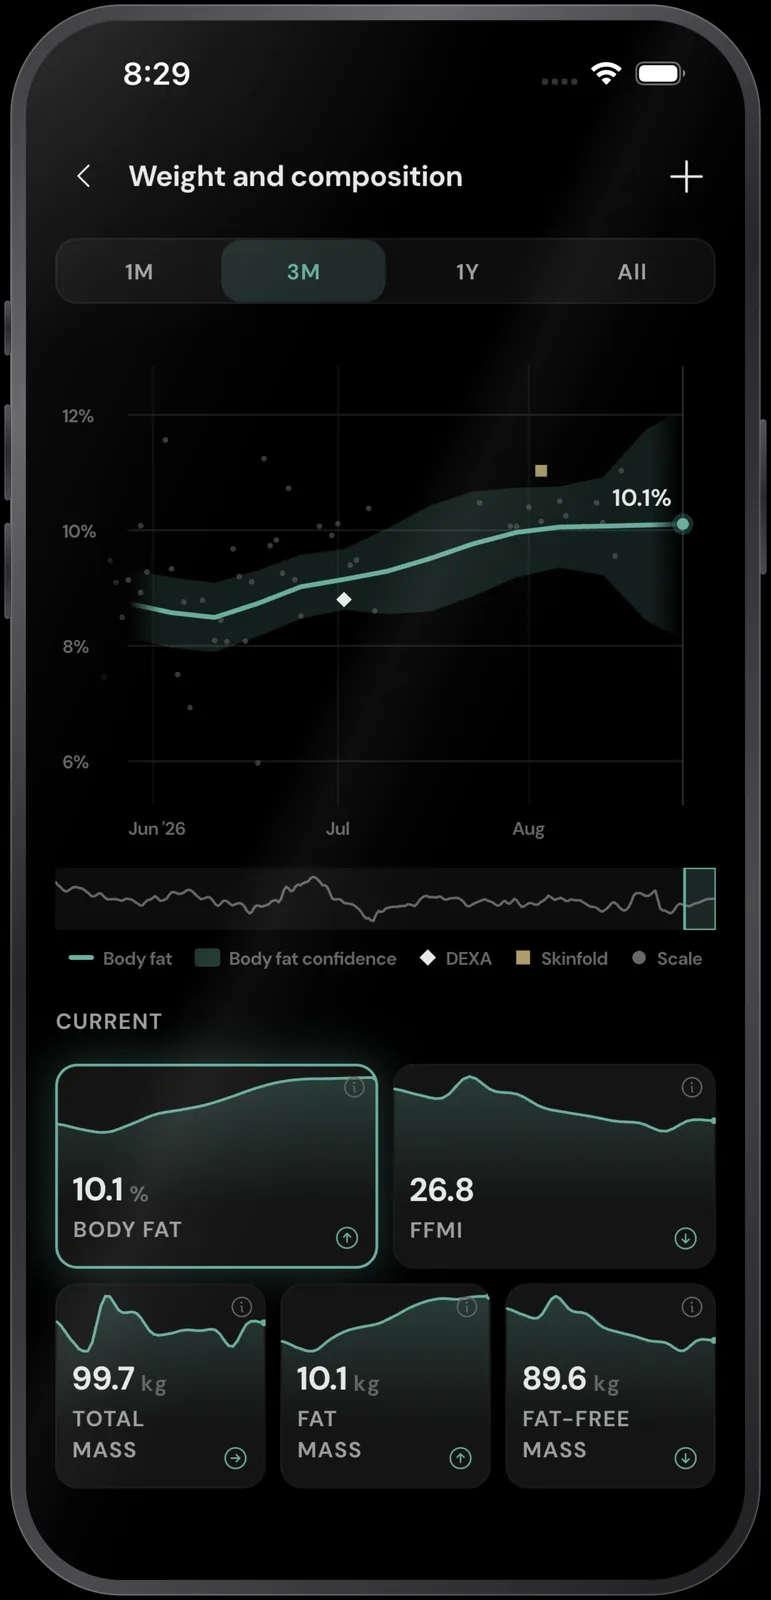
How does the smoothing actually work?
Most trend weight features use one line of arithmetic. Today’s trend equals yesterday’s trend plus a fixed fraction of the gap between today’s reading and yesterday’s trend:
trend_today = trend_yesterday + alpha * (weight_today - trend_yesterday)
Rearranged, which is the form you’ll see in code:
trend_today = alpha * weight_today + (1 - alpha) * trend_yesterday
That fraction, alpha, is the entire tuning knob. The lifter version of this originates in John Walker’s The Hacker’s Diet, which uses 0.1: each day the trend closes a tenth of the gap.
Nobody thinks in alpha. Half-lives are easier: the age at which a reading counts half as much as this morning’s. The conversion is alpha = 1 - 2^(-1/h), with h in days. Three are worth knowing:
- 7-day half-life, alpha 0.094, roughly a 20-day simple moving average. For aggressive cuts.
- 10-day half-life, alpha 0.067, roughly a 29-day simple moving average. The RESISTX default.
- 14-day half-life, alpha 0.048, roughly a 40-day simple moving average. For long bulks.
At a 10-day half-life, a reading from 10 days ago carries half the weight of today’s, 20 days ago a quarter, 30 days ago an eighth. Nothing ever leaves the calculation. It just fades.
It isn’t laziness. When researchers ran 10 reconstruction methods against real smart-scale data from 50 participants, an exponentially weighted moving average and Kalman smoothing tied for best agreement with observed weights at 0.62% to 0.64% RMSE. Random forest and k-nearest neighbours did worse. The one-line filter beat the machine learning.
Why does trend weight lag behind the scale, and by how much?
Lag is what the filter costs. Anything that suppresses a 0.53% daily wobble must also delay a genuine 0.1% per day change, so on a cut the trend sits above the scale and on a bulk it sits below, and it stays there until you stop.
With a 10-day half-life, the line responds like a 29-day simple moving average. A real inflection, the week you actually drop into deficit, takes several days to bend and 2 to 3 weeks to be fully reflected.
A simple moving average has worse problems than lag alone. It weights a 6-day-old reading exactly like this morning’s. It jumps discontinuously when an old value falls out of the window. Its average lag is (N-1)/2 days, so a 14-day average runs about 6.5 days behind. And it degrades when you skip days, because the window empties.
The trade-off is response against false alarms. I set RESISTX to 10 days because it absorbs 2 to 3 day noise, like a refeed or a salty dinner, while still moving on a real trend within 2 to 3 weeks. Remember the consequence: if you changed something 5 days ago, the trend hasn’t finished telling you about it.
Is trend weight better than just taking a weekly average?
A 7-day average is a genuine improvement on one reading. It also gives a 6-day-old measurement the same vote as this morning’s, jumps every time a value leaves the window, and inherits the day-of-week problem: across 80 adults and 4,657 measurements, body weight was highest on Sunday and Monday and fell through the week.
In 1,421 frequent self-weighers the within-week swing averaged 0.35% of bodyweight, 0.41% in men and 0.29% in women, peaking on Monday and bottoming on Friday. Compare Monday to Friday and you manufacture a loss. Friday to Monday, a gain. About 0.3 kg on an 80 kg lifter, which is most of a good week.
| Single reading | 7-day rolling average | EWMA trend | |
|---|---|---|---|
| What it is | One morning’s total mass | Mean of the last 7 readings, weighted equally | Yesterday’s trend nudged toward today |
| Noise removed | None | Most 1 to 2 day noise | Most 1 to 3 day noise, decaying smoothly |
| Lag | None | About 3 days | Like a 29-day average at a 10-day half-life |
| Skipped days | Fewer points, same noise | Window shrinks, line gets noisier | Trend carries, next reading updates it |
| After a refeed | Jumps 1.0 to 1.5 kg | Jumps, then jumps back when the day drops out | Absorbs it, band widens |
| Good for | Feeding a filter | Eyeballing a fortnight | Deciding whether to change calories |
The weekend swing isn’t a warning sign. In that 80-person dataset the compensation pattern, up over the weekend and back down through the week, was strongest in the people who lost or maintained weight and weakest in those who slowly gained.
How often should you weigh yourself for the trend to work?
Daily, first thing, after the toilet and before food or drink. In a cohort of 9,768 smart-scale users, only daily self-weighing was associated with weight loss in every BMI group, while every other day or less was associated with unchanged or increased weight.
The cohort logged a median 352 measurements over about 1,085 days, averaging 2.8 weigh-ins a week. Frequency correlated inversely with weight change at r = -0.111 overall and -0.148 in the highest BMI group. People who let 30 or more days pass between weigh-ins gained 0.58 kg, 0.93 kg or 1.37 kg by group. This is a general smart-scale population, not a training population, so read it as a pattern among people who own scales.
Spacing weigh-ins out doesn’t hand you a cleaner number either. In the standardised series, the standard deviation of the difference rose from 0.53% at a 1-day interval to 0.69% at 7 days. Weighing weekly gives you one noisy number instead of seven, with nothing filtering it.
RESISTX syncs weight two ways with Apple Health and Health Connect. A smart-scale reading arrives without typing. Logging is offline-first, so a 6 am weigh-in with no signal still writes. Every reading is stored with its timestamp rather than one per day. The reading that feeds the trend is chosen in order: a reading you’ve flagged, then one tagged morning fasted, then the earliest of the day. Other readings remain in the record for comparison.
How long before you should change anything based on the trend?
Give it 28 days of daily weigh-ins before you act. Hall and Chow showed that daily weights over intervals longer than 28 days were required to estimate a change in energy intake with a 95% confidence interval narrower than 300 kcal per day, and even then the residual in their worked case was a standard deviation of 180 kcal per day, with a 95% interval of 350 kcal per day either side.
Their simulations assumed day-to-day fluctuation with a standard deviation of about 0.5 kg. That’s the 0.53% figure arriving independently from a different direction.
Compare 28-day blocks, not weeks. A fortnight of flat trend inside a genuine deficit sits within the noise, and it isn’t evidence that your metabolism has stalled.
RESISTX back-calculates expenditure from logged intake and weight trend. It shows it with a projection, an uncertainty band and a confidence indicator: a starting estimate blended with logged data as complete food records accumulate. The calibrated label requires 21 complete days and a usable weight trend, which may take longer than 21 calendar days. You read the confidence, not a bare figure.
RESISTX uses a fixed 7,700 kcal/kg conversion in its current expenditure estimator. Body-fat measurements do not change that conversion. Training records, including sets per muscle group per week, give you another way to assess progress alongside the intake and weight history.
Body-composition measurements also have their own uncertainty, depending on the method and measurement conditions. The body-fat method comparison covers what those measurements can detect; it is not evidence that a scan makes the expenditure estimate more accurate.
When should you ignore your trend weight entirely?
When something has moved your water or your gut contents rather than your tissue. The filter can’t tell the difference, so it will faithfully smooth bad data into a confident wrong answer. Each of these is bigger than a week of real progress:
- Creatine loading. 25 g/day for 7 days then 5 g/day added 1.37 L of total body water by day 7, 2.04 L by day 28 and 1.31 kg of body mass at day 28 in 32 subjects, 55.4% of it intracellular.
- A carbohydrate refeed. Muscle glycogen is stored with 3 to 4 g of water per gram, with observed ratios running from 1:3 to 1:17 depending on fluid intake, and carbohydrate loading moved body weight about 1.0 to 1.5 kg.
- The menstrual cycle. Across one full cycle in 42 women, body weight fell 0.450 kg in the first week alongside a 0.585 L drop in total body water and 0.474 L in extracellular water.
- A bulk to cut switch, or the reverse. Glycogen shifts alone account for roughly 1.4 to 2.7 kg in the first 1 to 2 weeks, before any fat moves.
- Christmas. Body weight rose 1.35% over the holidays in the NoHoW cohort and was still about 0.35% elevated in March, so a January step is real and the filter should be allowed to follow it.
A 1% per week cut on an 80 kg lifter is 0.8 kg. Every item on that list matches or beats it. Start creatine in week 3 of a cut and the scale erases a fortnight of work your body actually did.
RESISTX can retain its adaptive estimate through missing weigh-ins, with confidence reduced as weight evidence ages. The estimate uses food and weight records; it cannot identify the cause of a water shift from those inputs alone. Record those events so you can interpret the trend in context, rather than assuming the algorithm has identified what moved the water.
Questions people ask
Why is my trend weight higher than my scale weight?
Because you’re losing. The trend still contains the last few weeks, so during a genuine deficit it sits above this morning’s reading, and during a genuine surplus it sits below. The size of the gap is a rough read on how fast you’re moving. When the trend converges onto the scale, you’re maintaining.
How long does it take trend weight to catch up to the scale?
Days, and the exact number is set by the half-life. At 10 days the trend closes half the remaining gap in 10 days, three quarters in 20, seven eighths in 30. A genuine step change, a creatine start or a bulk to cut switch, takes 2 to 3 weeks to be fully reflected, which is why resetting calories in the first fortnight after a phase change is guesswork.
Does trend weight still work if I skip days?
Yes. An exponentially weighted average has no fixed window, so a missed day means the last trend value carries and the next reading updates it. What degrades is confidence, not the line. A simple moving average genuinely gets noisier with gaps. Don’t lean on it, though: in the 9,768-user cohort, people with gaps of 30 or more days gained 0.58 to 1.37 kg.
Is trend weight the same as a 7-day average?
No, though they’re close relatives. A 7-day average gives a 6-day-old reading the same weight as this morning’s and jumps whenever a value leaves the window. An exponential trend decays old readings smoothly and never jumps. The weekly average also carries the day-of-week bias, peaking Monday and bottoming Friday, so which days sit in the window shifts the answer.
How much weight can you actually gain or lose overnight?
In tissue, almost none: a 1% per week cut is about 0.11 kg a day on an 80 kg lifter. In scale weight, plenty. A standard deviation of 0.53% makes 0.4 kg an ordinary day and 0.85 kg a routine 2 SD one. An overnight kilogram can’t be fat, because gaining a kilogram of fat takes roughly 9,400 kcal of surplus. Weigh, log it, let the filter do the work.